Exploring the servers in ‘serverless’ AWS Lambda, Part I

AWS Lambda pioneered serverless compute offerings. With serverless compute we don’t need to know about the underlying servers that ensure that our application is always on (available) and scaled to match the current load.
No need, but that doesn’t mean that I don’t want to know.
Consulting the official docs
Curious about the inner workings I read all the docs I could find on docs.aws.amazon.com. It turns out Amazon gives little information about what we can expect from the execution environment. The docs describe a temporary runtime that may or may not be reused. In the case that the runtime is fresh there is a penalty for initialization known as the “cold-start”. That, and the promise that a 500MB disk is mounted to /tmp that remains when the runtime is reused, is pretty much all we know.
Maybe, because what you don’t promise you don’t need to keep.. this gives Amazon much flexibility, but in any case because it is a simple model that enables AWS Lambda to launch as many copies of a function as needed to scale to the incoming rate of events and requests.
A relatively old blog post on AWS Compute Blog explains that AWS Lambda functions execute in a container. The container technology allows for the necessary isolation and assigns exactly the resources, e.g. memory, specified in the function’s configuration. That memory configuration (min. = 128 MB, max. = 3008 MB) is the only parameter we can tweak. This seems like limited control at first, but this setting does not only affect the available memory but also proportionally scales other resources, such as CPU. And, maybe more importantly, it improves the consistency and predictability of Lambda performance, as shown by this blog.
Exploring the Java8 runtime a bit
So to learn about the inner workings I played around with a Java-based Lambda deployed using the Java8 runtime.
First idea was to log the reference name of the Lambda function handler object, i.e this.toString(), and put some load on it. It turns out these are always the same (except when they are not – for no apparent reason). This is intriguing for many reasons; Are they cloning the whole runtime? But besides that, I observed that the number of log-streams in the CloudWatch Logs group associated with my Lambda function was growing.
These CloudWatch logs have a unique id and when putting them under some load (I used ‘ab’, the Apache HTTP server benchmarking tool) the amount of log streams grew according to the number of concurrent threads firing requests. Hence, it turns out that the log stream name uniquely identifies the container. But I wanted more proof, some validation. I wanted to show that for each lambda execution within a log stream a cold start happened just one time, to proof that this corresponds to a reusable container. This turned out to be true. I validated this by writing a file to /tmp called /tmp/reused.txt, if the file did not exist yet it was logged that the container was fresh, otherwise (when the file did exist) it was logged that the container was reused.
By analyzing the log files with a script I was able to create a tables like this example created by running 1000 requests with 10 concurrent clients:
                    container-id  invocations   cold
77cebe101efa4d84bd7196ed297de18f           22      1
aea4816b4fbe4865a000655e43ad6168          133      1
0f5b29cc53814cf480fb7d70a028c76d          105      1
cbe226495d2b42d095514f129c7dd5f7          118      1
e1dc715141924461ada8aa2ff1c776c9           18      1
09b3f58d3b56489f95fb7da81aba9d09          114      1
c97f53da65a8470f85b19627a59bd3ab          133      1
02c9545582394ce1932ae6d5cb950b04          108      1
6cffe76c5d194e75af7c97129ab484de          118      1
a546219f5aeb47d28e109d12e82b06fb          131      1
                                         ----
                                         1000
Besides showing that a cold start happens only one time per execution environment, it also showed that the number of requests per container are not evenly distributed. Additional experiments with more requests and more concurrent requests showed even more unevenly distributed results.
Exploring further by visualizing
I wanted to see how these calls are actually distributed in time and decided to plot the invocations in time series per container: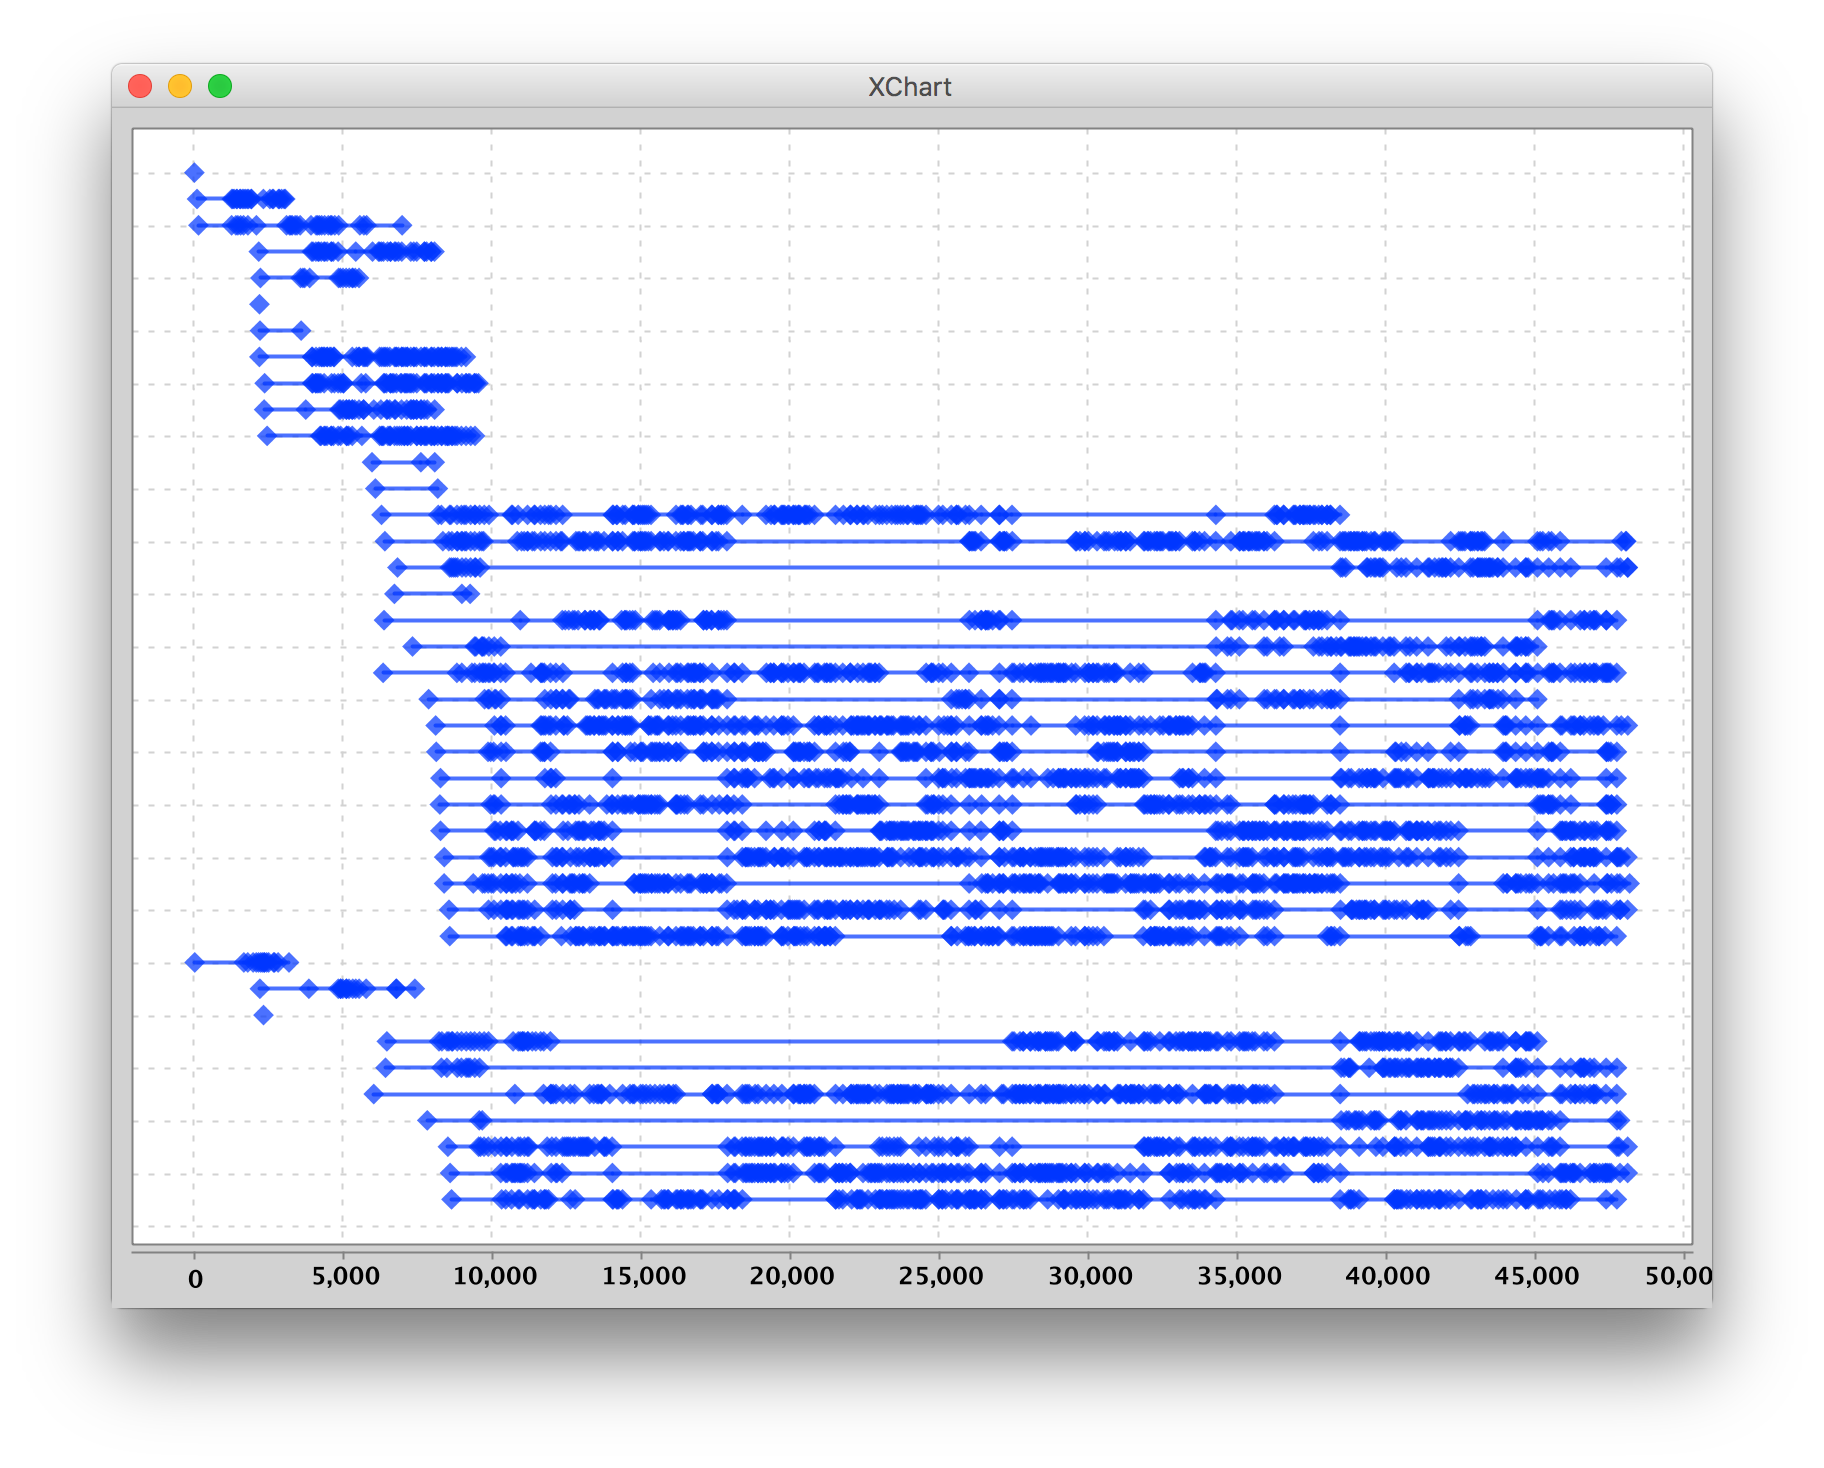 Interesting to see how some containers are constantly handling request while other have longer periods of idle. What I noticed after looking at it for while is that some containers seem to stop processing requests at a certain point, typically together with containers that started processing requests at around the same time. Therefore, I sorted the plots by the container’s first handled request:
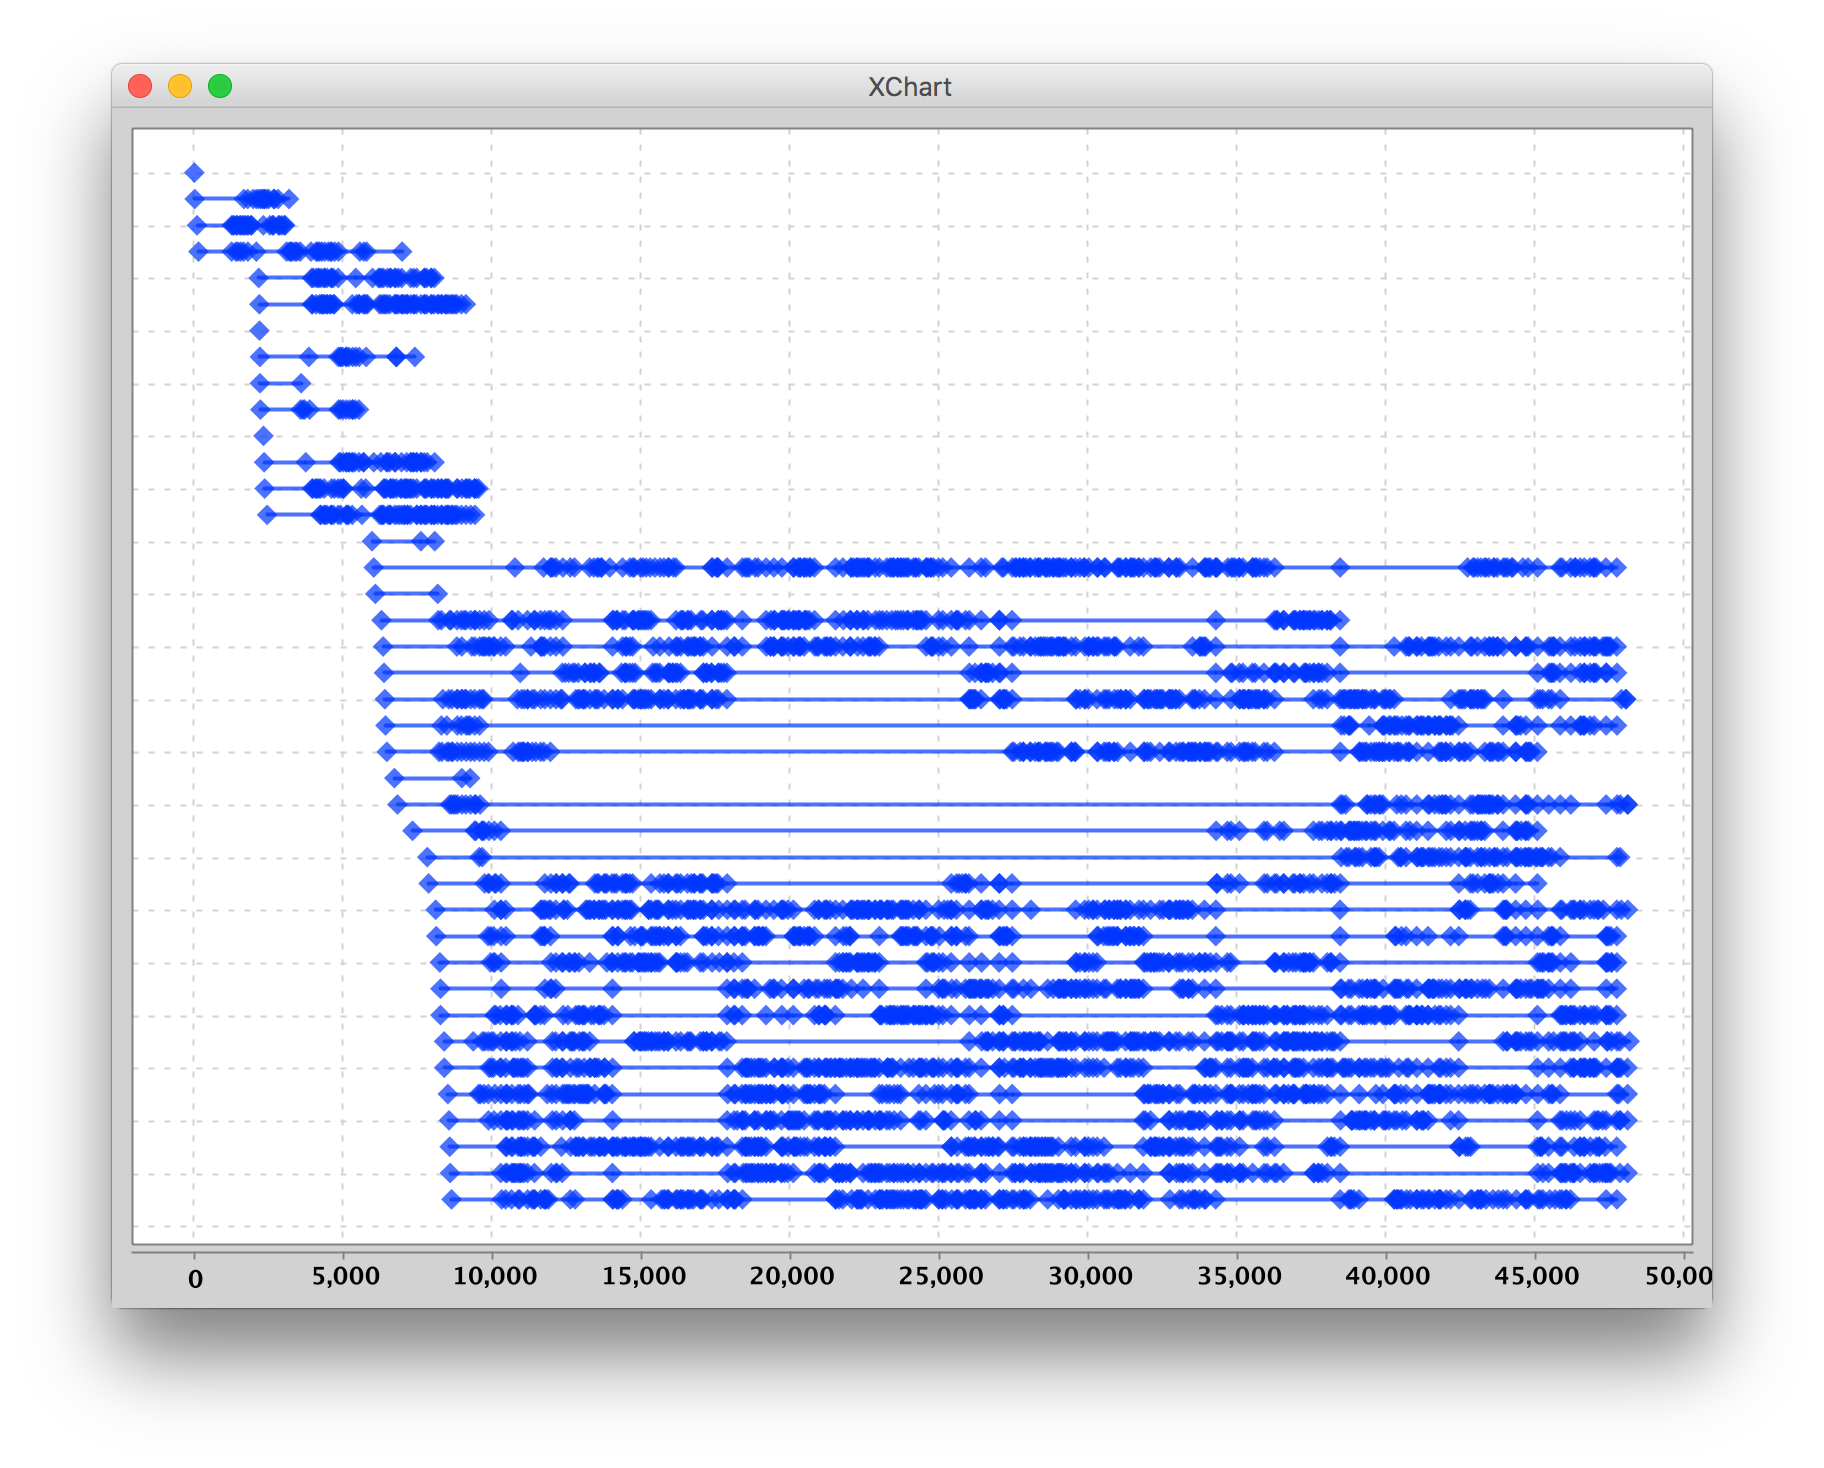 Now we can see how these different groups of containers that appear together, start handling requests, and seem to disappear together as well. The number of containers is scaled to 4 quickly, after the rate of incoming requests is metered a new batch of 10 containers is started, and when the load persists an even bigger batch is spawned. At this moment I suspected different hosts running the containers, so I included the hostname of the lambda in the log. And yes, I could indeed see different hostsnames!
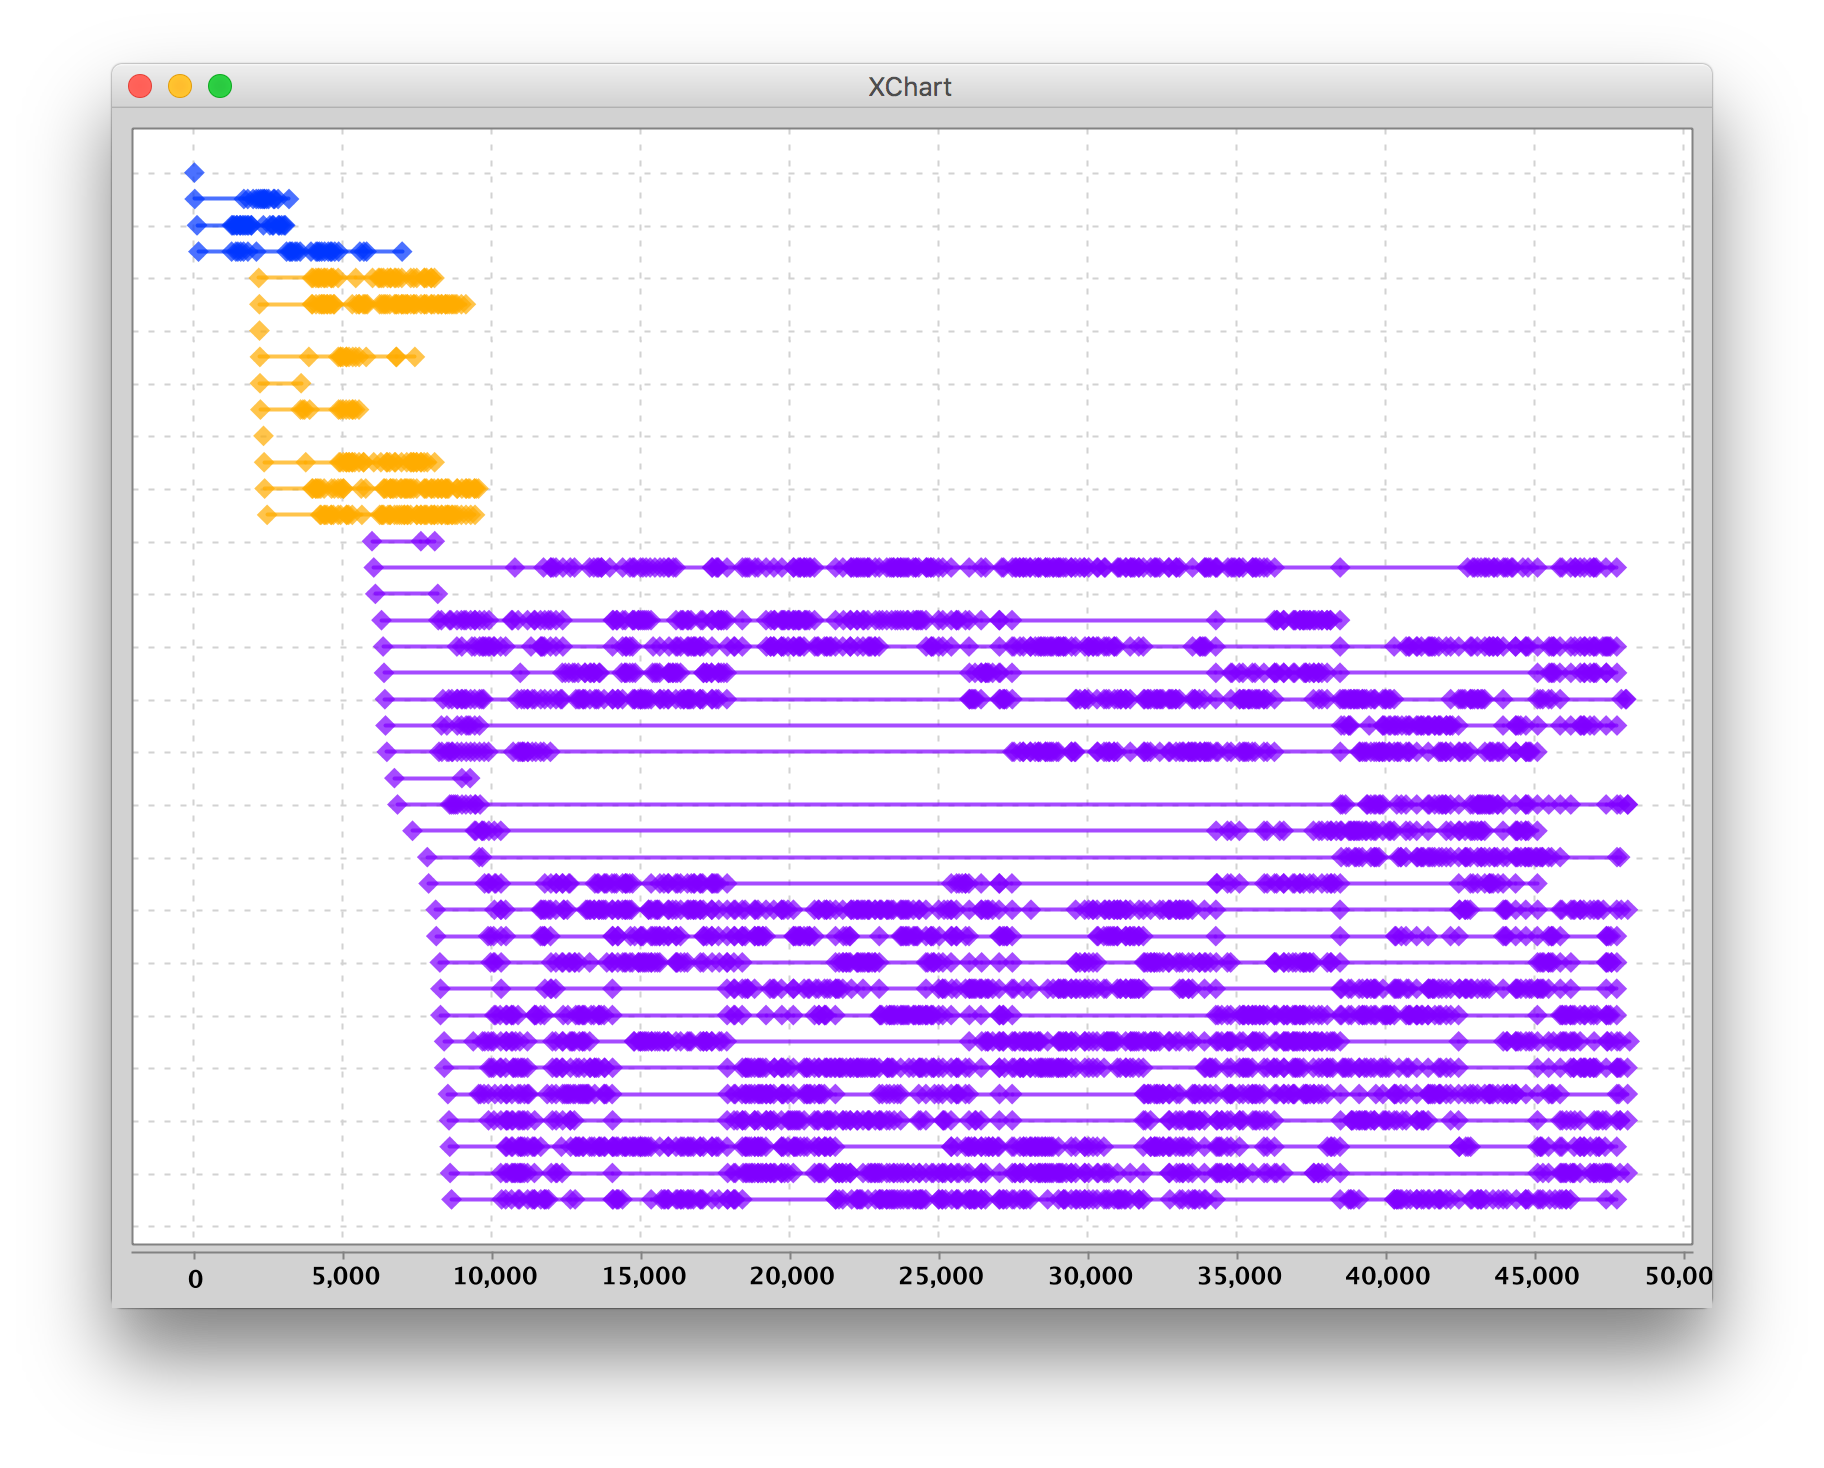
When using a different color per hostname, I was able to create the following plot:
I decided to log information from /proc/cpuinfo as well to see if the specs of these hosts differ too. It turns out they sometimes do; I encountered different CPU models, such as “Intel(R) Xeon(R) CPU E5-2666 v3 @ 2.90GHz” and “Intel(R) Xeon(R) CPU E5-2680 v2 @ 2.80GHz” with varying bogomips.
In this specific run, the number of containers scales in growing batches on different hosts. Only 10 secs in, we already had containers on two different hosts (blue and orange) and these didn’t continue to the end. Or at least, they didn’t handle any requests after that, while many requests were still coming in. What we can see is that from then on all requests are handled by the third (purple) host. It could be that AWS prefers to have the lambda’s on a single hosts that fits the load, if possible. So it seems in this run.. But other runs showed different and less ‘dramatic’ results.
So to end with where we started– Amazon won’t tell us, we don’t really need to know, but I am curious and therefore keep exploring, every now and then.
To be continued.. 😉